
![]() Mon Jun 27, 2022 4:58 pm
Mon Jun 27, 2022 4:58 pm
Hello there..
For a few years now I know a speed issue, which is very prominent to me when working with Optical Flow tools and a total frame window beyond 3 or 5. I'm aware that caching might be slower, at a point, when all memory is already in use by Fusion, but this is pervasive on all compositions here in different flavours.
What I did to recreate this in a smaller scope is this composition file:
http://scientific-media.de/_exchange/bmdf/Fusion_SpeedLoss_v02.comp
On a system with 32GB RAM it was sufficient to render ~100 frames starting at frame 10. The output folder will be created right next to the comp-file and no external footage is needed.
The Issue:
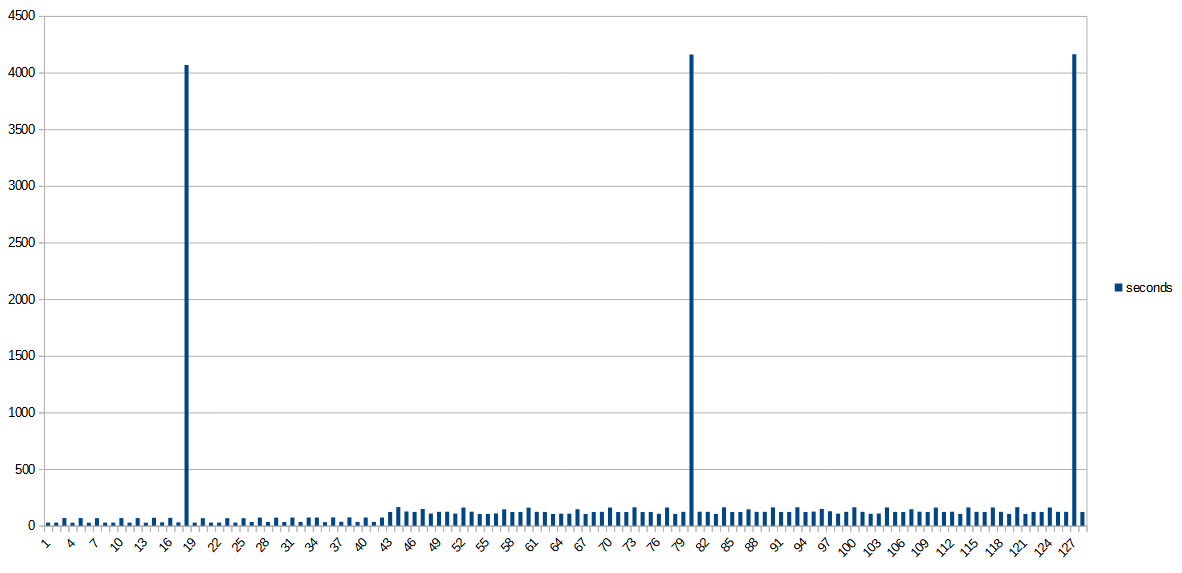
The render performance is slowing down significantly, when there is no more free memory (starting @ image 43) to use right away, so it might be related to that or certain tools, that the speed (timestamp difference between written images) changes over time.
Although there is no other process running, which might need larger resources too, there are also some images, which took much more time, than others (by mod-date). This can be seen by the high bars, which appear more frequently, the longer the rendering goes. This is not GUI related or at least this was rendered by the render manager.
It is interesting that the average render time per frame - shown by Fusion - is increasing mainly by these few very "slow" images, since the overall speed in the graph is not changing that much, after all memory is consumed.
It would be interesting to know, if this is a general issue and if there are things to circumvent that. Caching certain nodes i.e. wasn't helping me.
Regards,
Rainer
For a few years now I know a speed issue, which is very prominent to me when working with Optical Flow tools and a total frame window beyond 3 or 5. I'm aware that caching might be slower, at a point, when all memory is already in use by Fusion, but this is pervasive on all compositions here in different flavours.
What I did to recreate this in a smaller scope is this composition file:
http://scientific-media.de/_exchange/bmdf/Fusion_SpeedLoss_v02.comp
On a system with 32GB RAM it was sufficient to render ~100 frames starting at frame 10. The output folder will be created right next to the comp-file and no external footage is needed.
The Issue:
The render performance is slowing down significantly, when there is no more free memory (starting @ image 43) to use right away, so it might be related to that or certain tools, that the speed (timestamp difference between written images) changes over time.
Although there is no other process running, which might need larger resources too, there are also some images, which took much more time, than others (by mod-date). This can be seen by the high bars, which appear more frequently, the longer the rendering goes. This is not GUI related or at least this was rendered by the render manager.
It is interesting that the average render time per frame - shown by Fusion - is increasing mainly by these few very "slow" images, since the overall speed in the graph is not changing that much, after all memory is consumed.
It would be interesting to know, if this is a general issue and if there are things to circumvent that. Caching certain nodes i.e. wasn't helping me.
Regards,
Rainer
Rainer M. Engel
scientific|Media imageLAB Berlin, Germany
scientific|Media imageLAB Berlin, Germany